|
Chanuka Algama Short Bio. Chanuka is currently a PhD student at the Department of Computer Science, Tulane University, under the supervision of Prof Carola Wenk. He is also a research fellow with the Data, Algorithms, and Policy (DAP) team at LIRNEasia, a leading think tank active across Asia-Pacific region. His interests lie in computer vision applications with a specific focus on optimal point correspondence and trajectory analysis. His work was recently recognized when he won the 2nd place at the IEEE’s Standards for Secure and Trusted Learning Systems competition held in Valencia, Spain. His work at LIRNEasia focused on using remote sensing and machine learning for public policy applications. Chanuka has recently published his work ‘Informing public policy with machine learning: mapping poverty in Sri Lanka using remote sensing and satellite imagery data’ at AAAI 2025 under AI for public missions. His current work involves using large trajectory datasets to find anomalies in the data. |
|
ResearchMost of my research primarily focuses on optimal point correspondence in visual fields and machine learning for public policy applications. Some papers are highlighted. |
|
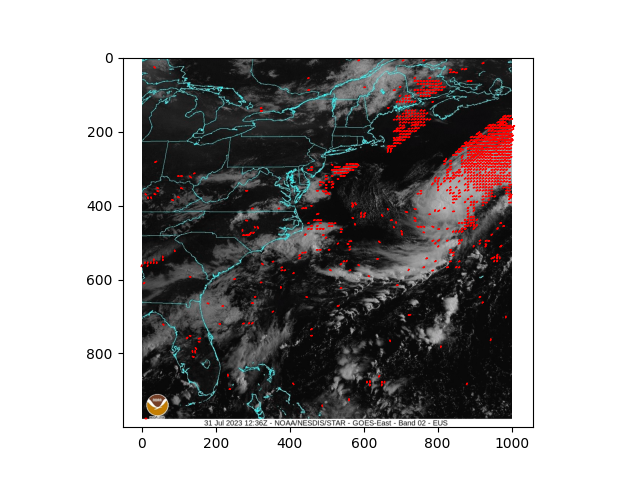
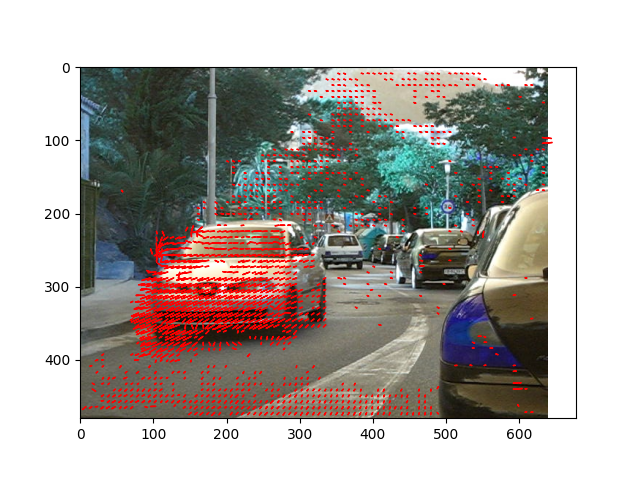
Robust Optical Flow calculation: A higher order differential approach
Under review at VISAPP, 2026
Primary Focus: Solutions for the challenge of optimal correspondence calculation under conditions of substantial nonlinear motion patterns and vulnerability of the flow constraint to rapid spatial transformations.
|
.png)
|
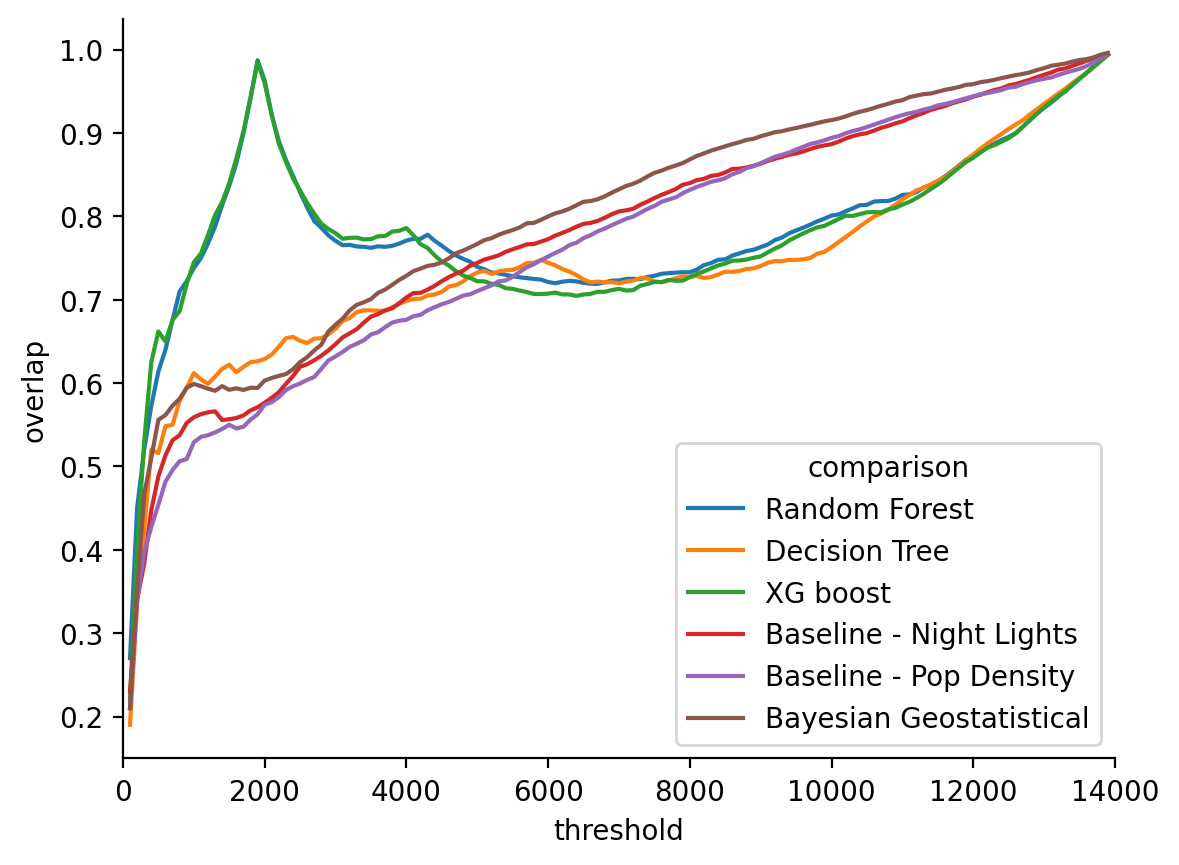
Informing Public Policy with Machine Learning: Mapping Poverty in Sri Lanka Using Mobile Call Detail Records and Remote Sensing Data
Kasun Amarasinghe Merl Chandana Viren Dias Published AAAI 2025, AI for Public Missions Pinpointing where poverty is most severe and tracking its changes over time is crucial for facilitating and monitoring the effects of poverty alleviation initiatives. However, traditional benchmarks like household surveys and national censuses often fall short—they’re expensive, resource-intensive, infrequent, and incapable of reflecting the full spectrum of household well-being. They often fail to account for geographic variation in cost of living, medical needs, or the costs of earning income. This gap is particularly pronounced in contexts like Sri Lanka, leading to a reliance on obsolete information when responding to economic shocks or disasters. On top of that, poverty cannot be determined by income data alone; rather, it’s multidimensional, where factors such as infrastructure, access to services, and economic activity also play a role in determining the well-being of a community |
|
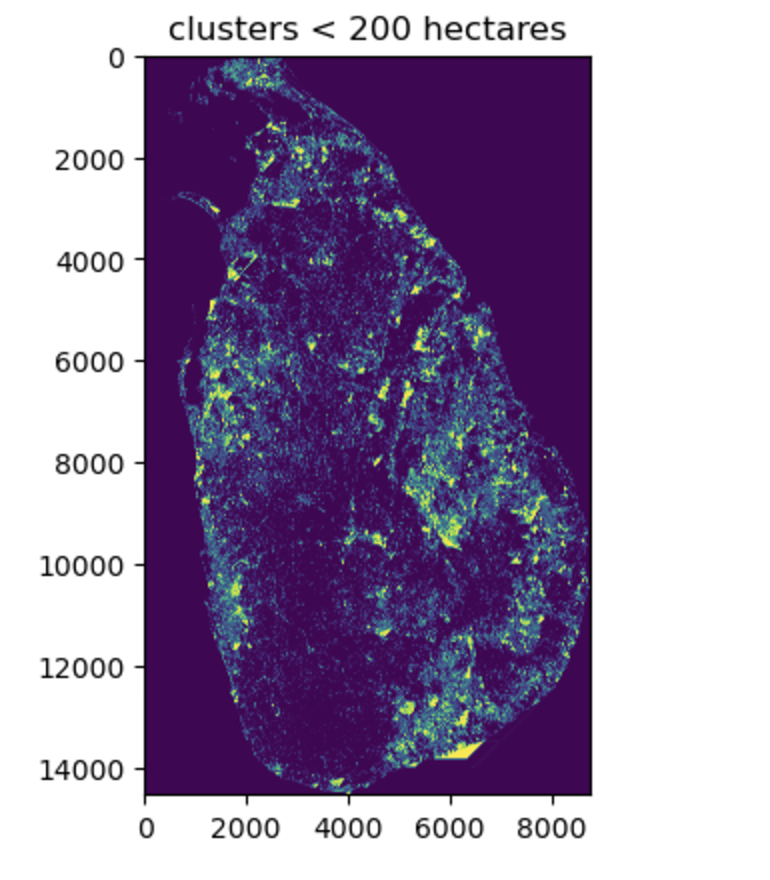
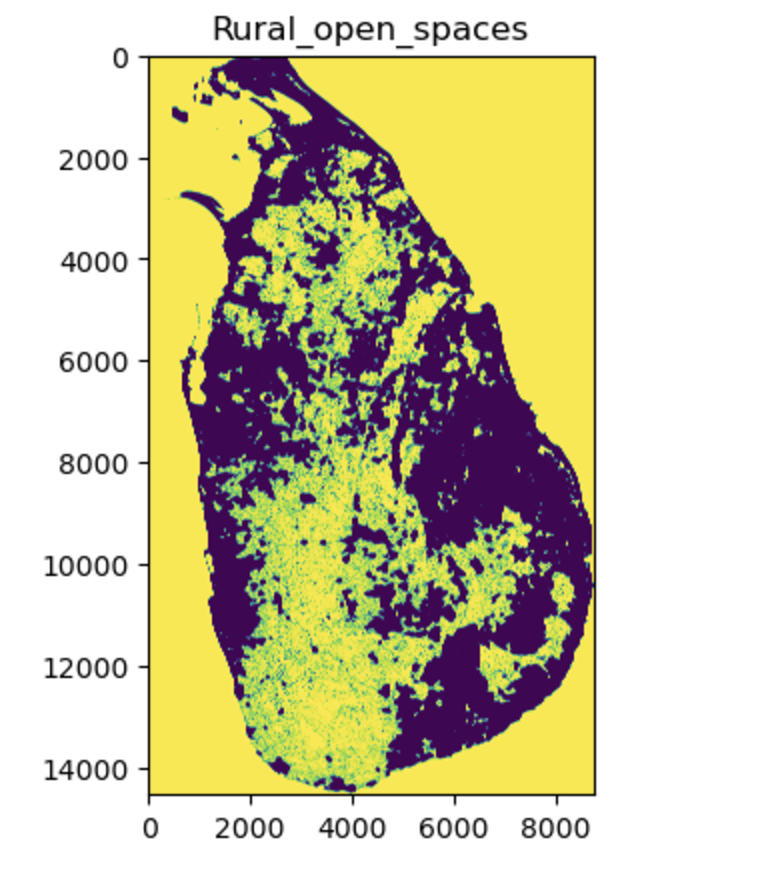
Using Medium Resolution Satellite Imagery and Machine Learning to Redefine Urban Areas in Sri
Lanka
This research introduced an end-to-end open-source pipeline to predict the Built-up (Bu) and Non-Built-up (NBU) areas using satellite band data. Finally, the project provides the code base for implementing the UN- Habitat definition What is a City, to understand the patterns, trends, and boundaries of urbanization. |

|
Conversational RAG with Memory-Based Context Enhancement
Primary Focus: RAG(Retrieval augmented generation) faces limitations in capturing context and understanding complex queries as the proximity of text chunks in the embedding space does not guarantee a meaningful question-and-answer pair. |
|
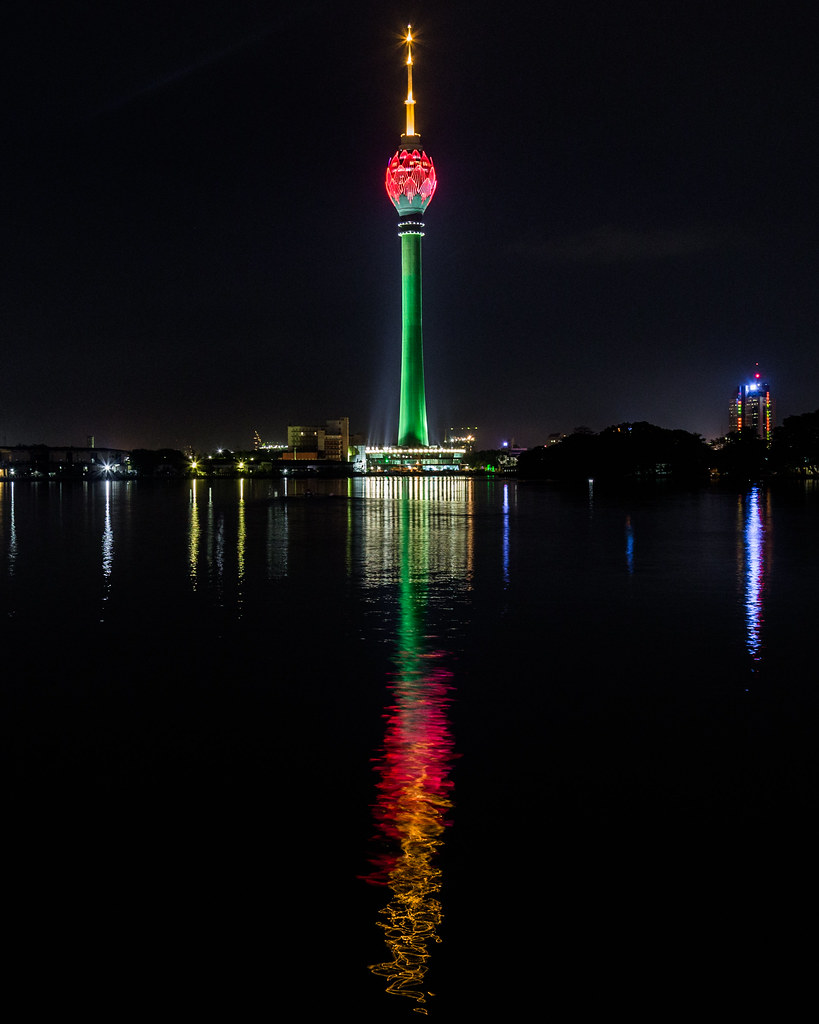
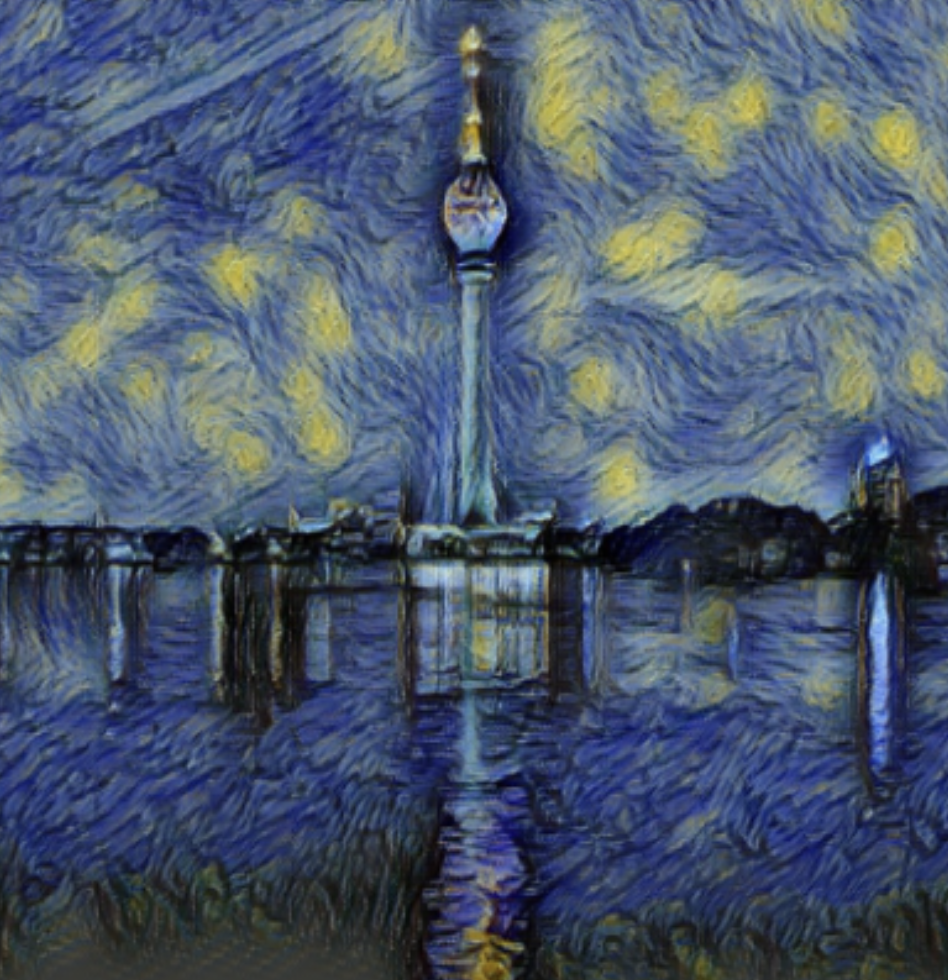
When Deep Learning Meets Van Gough
This works by using a deep neural network to take two images—a content image and a feature image—and blend them together so that the output image looks like the content image but "painted" in the style of the style image. VGG-19, a 19-layer CNN trained on the ImageNet dataset, is utilized here. Since this implementation doesn't require training or fully connected layers, the trainable parameters are set to False. To obtain a multi-level representation of the style image, feature correlations are calculated between different feature maps. The content loss between the content image and the output image is computed using the mean squared error (MSE) of localized shapes. However, for the style image, calculating loss through MSE is less effective, as the goal is to mimic the color and texture in the output image. Therefore, the Gram matrix is used to capture a more general representation of the style image. |
|
© Chanuka Algama 2025 |